Oli Darley
Data visualisation and generative art
Project maintained by olidarley Hosted on GitHub Pages — Theme by mattgraham
| Data Visualisation | Visual Communication | Generative Art |
I’m Oli. I’m a data visualisation designer, programmer and musician. I also make generative art. This page is a repository for my data sketches, prototypes, analysis and general musings.
Most of my work is coded in R or p5.js, though I also occasionally use Tableau, Flourish and Raw.
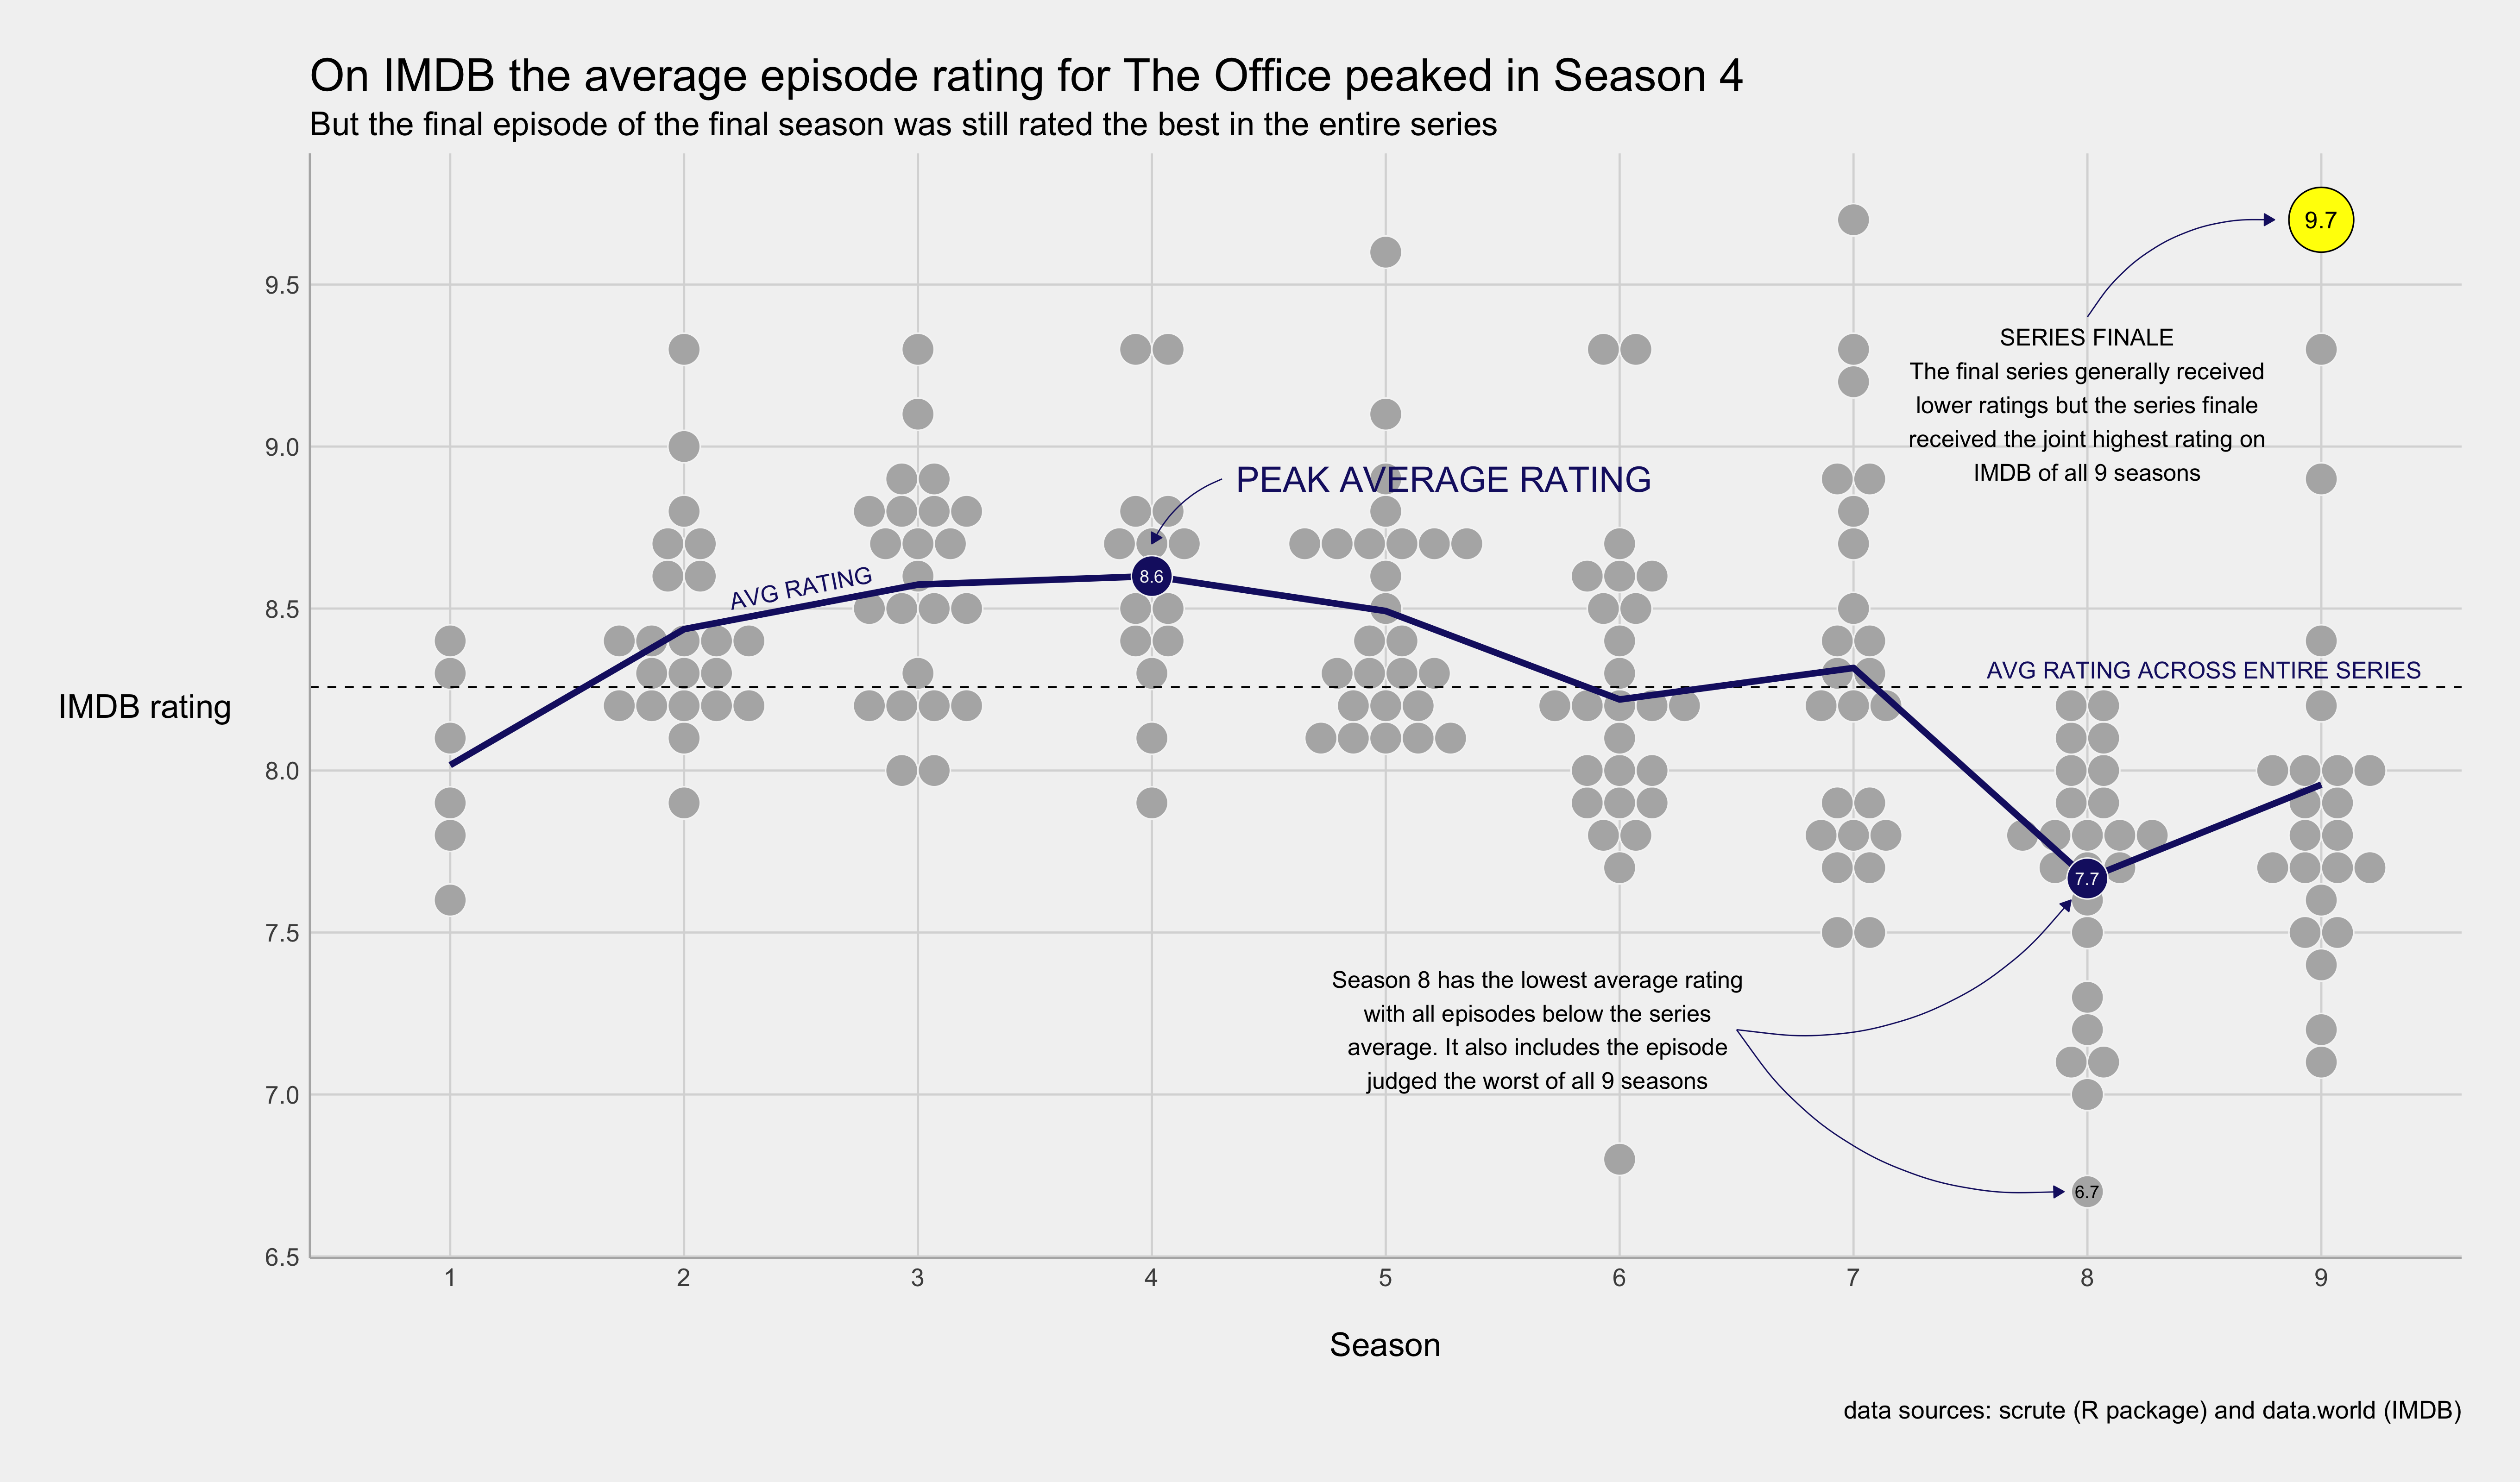
Tidy Tuesday R data project: Week 12
Visualising IMDB ratings for the Office
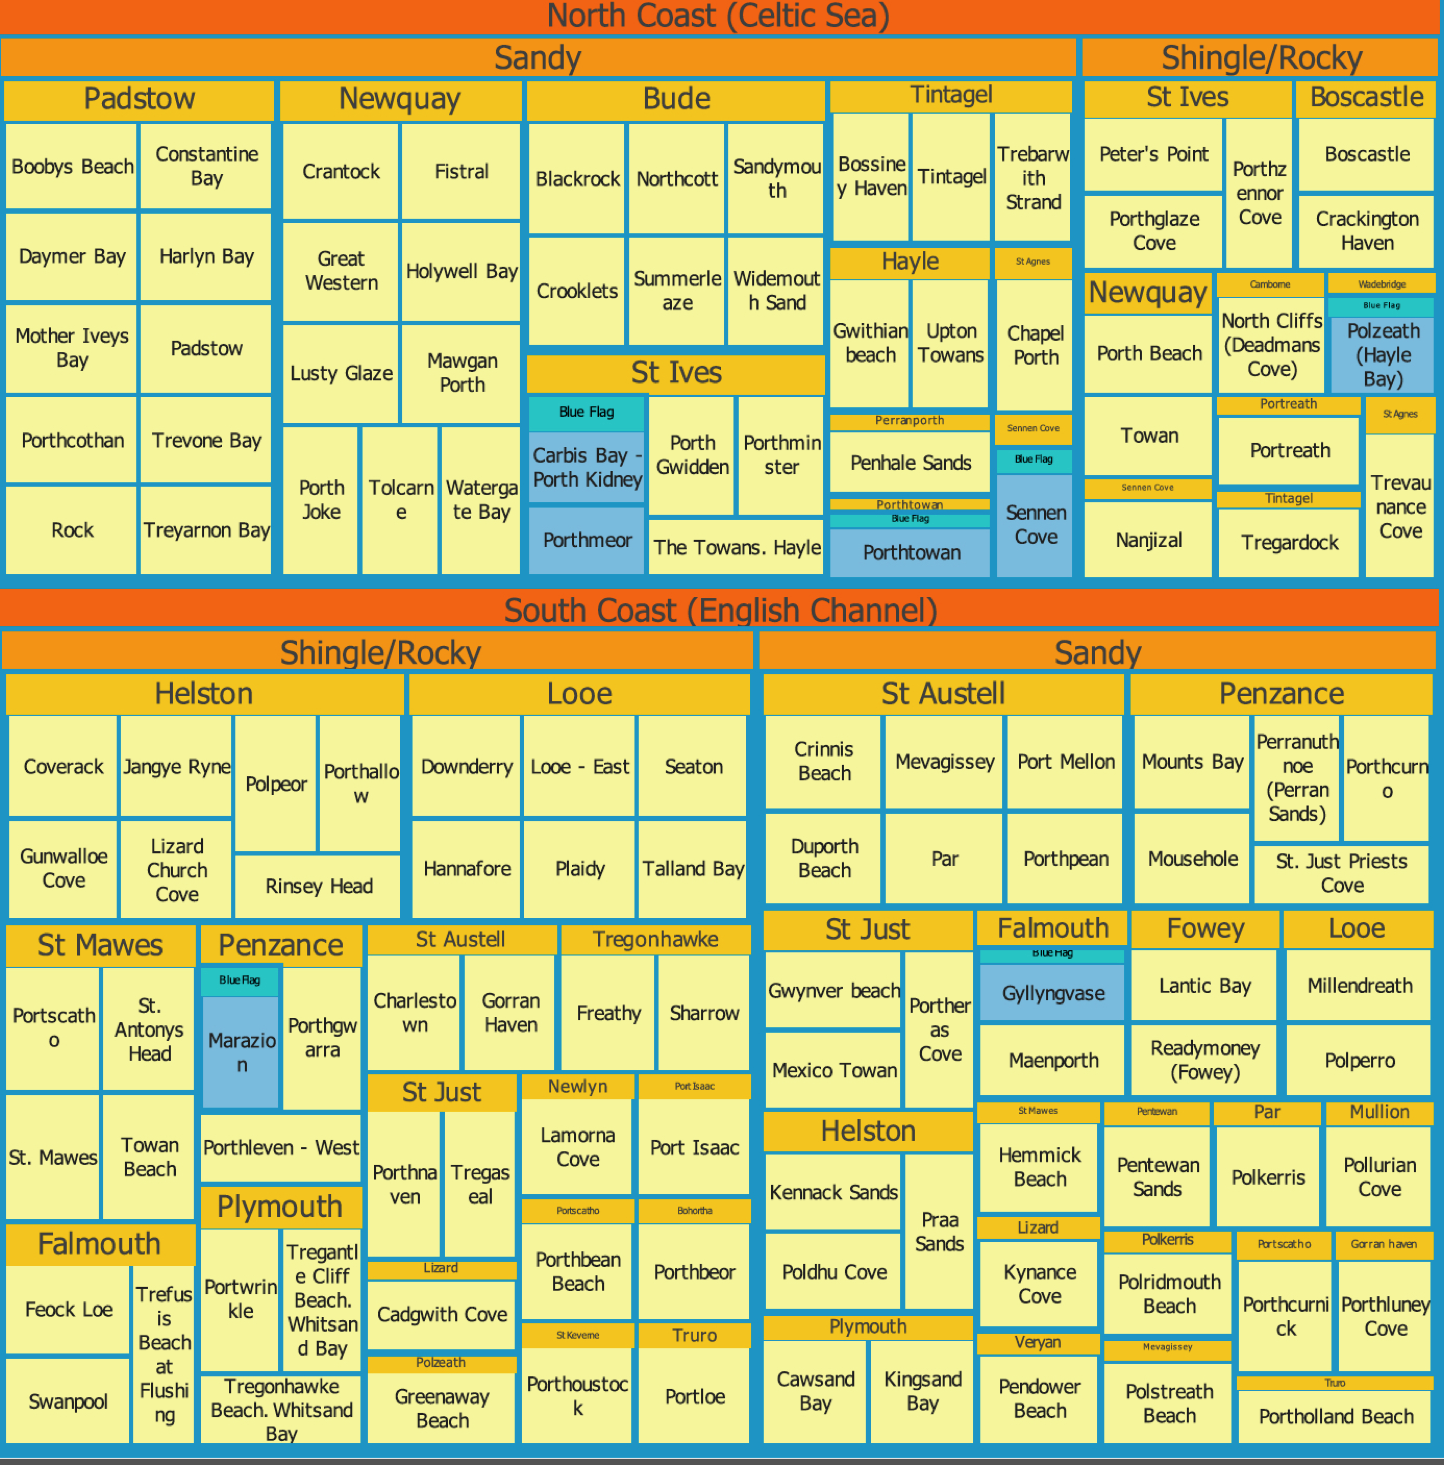
The north coast of Cornwall is famous for it’s big, sandy beaches
A kind of treemap. The leaf nodes in this case are the towns (eg Padstow) and the ‘weight’ which sizes them is the number of beaches in that area.
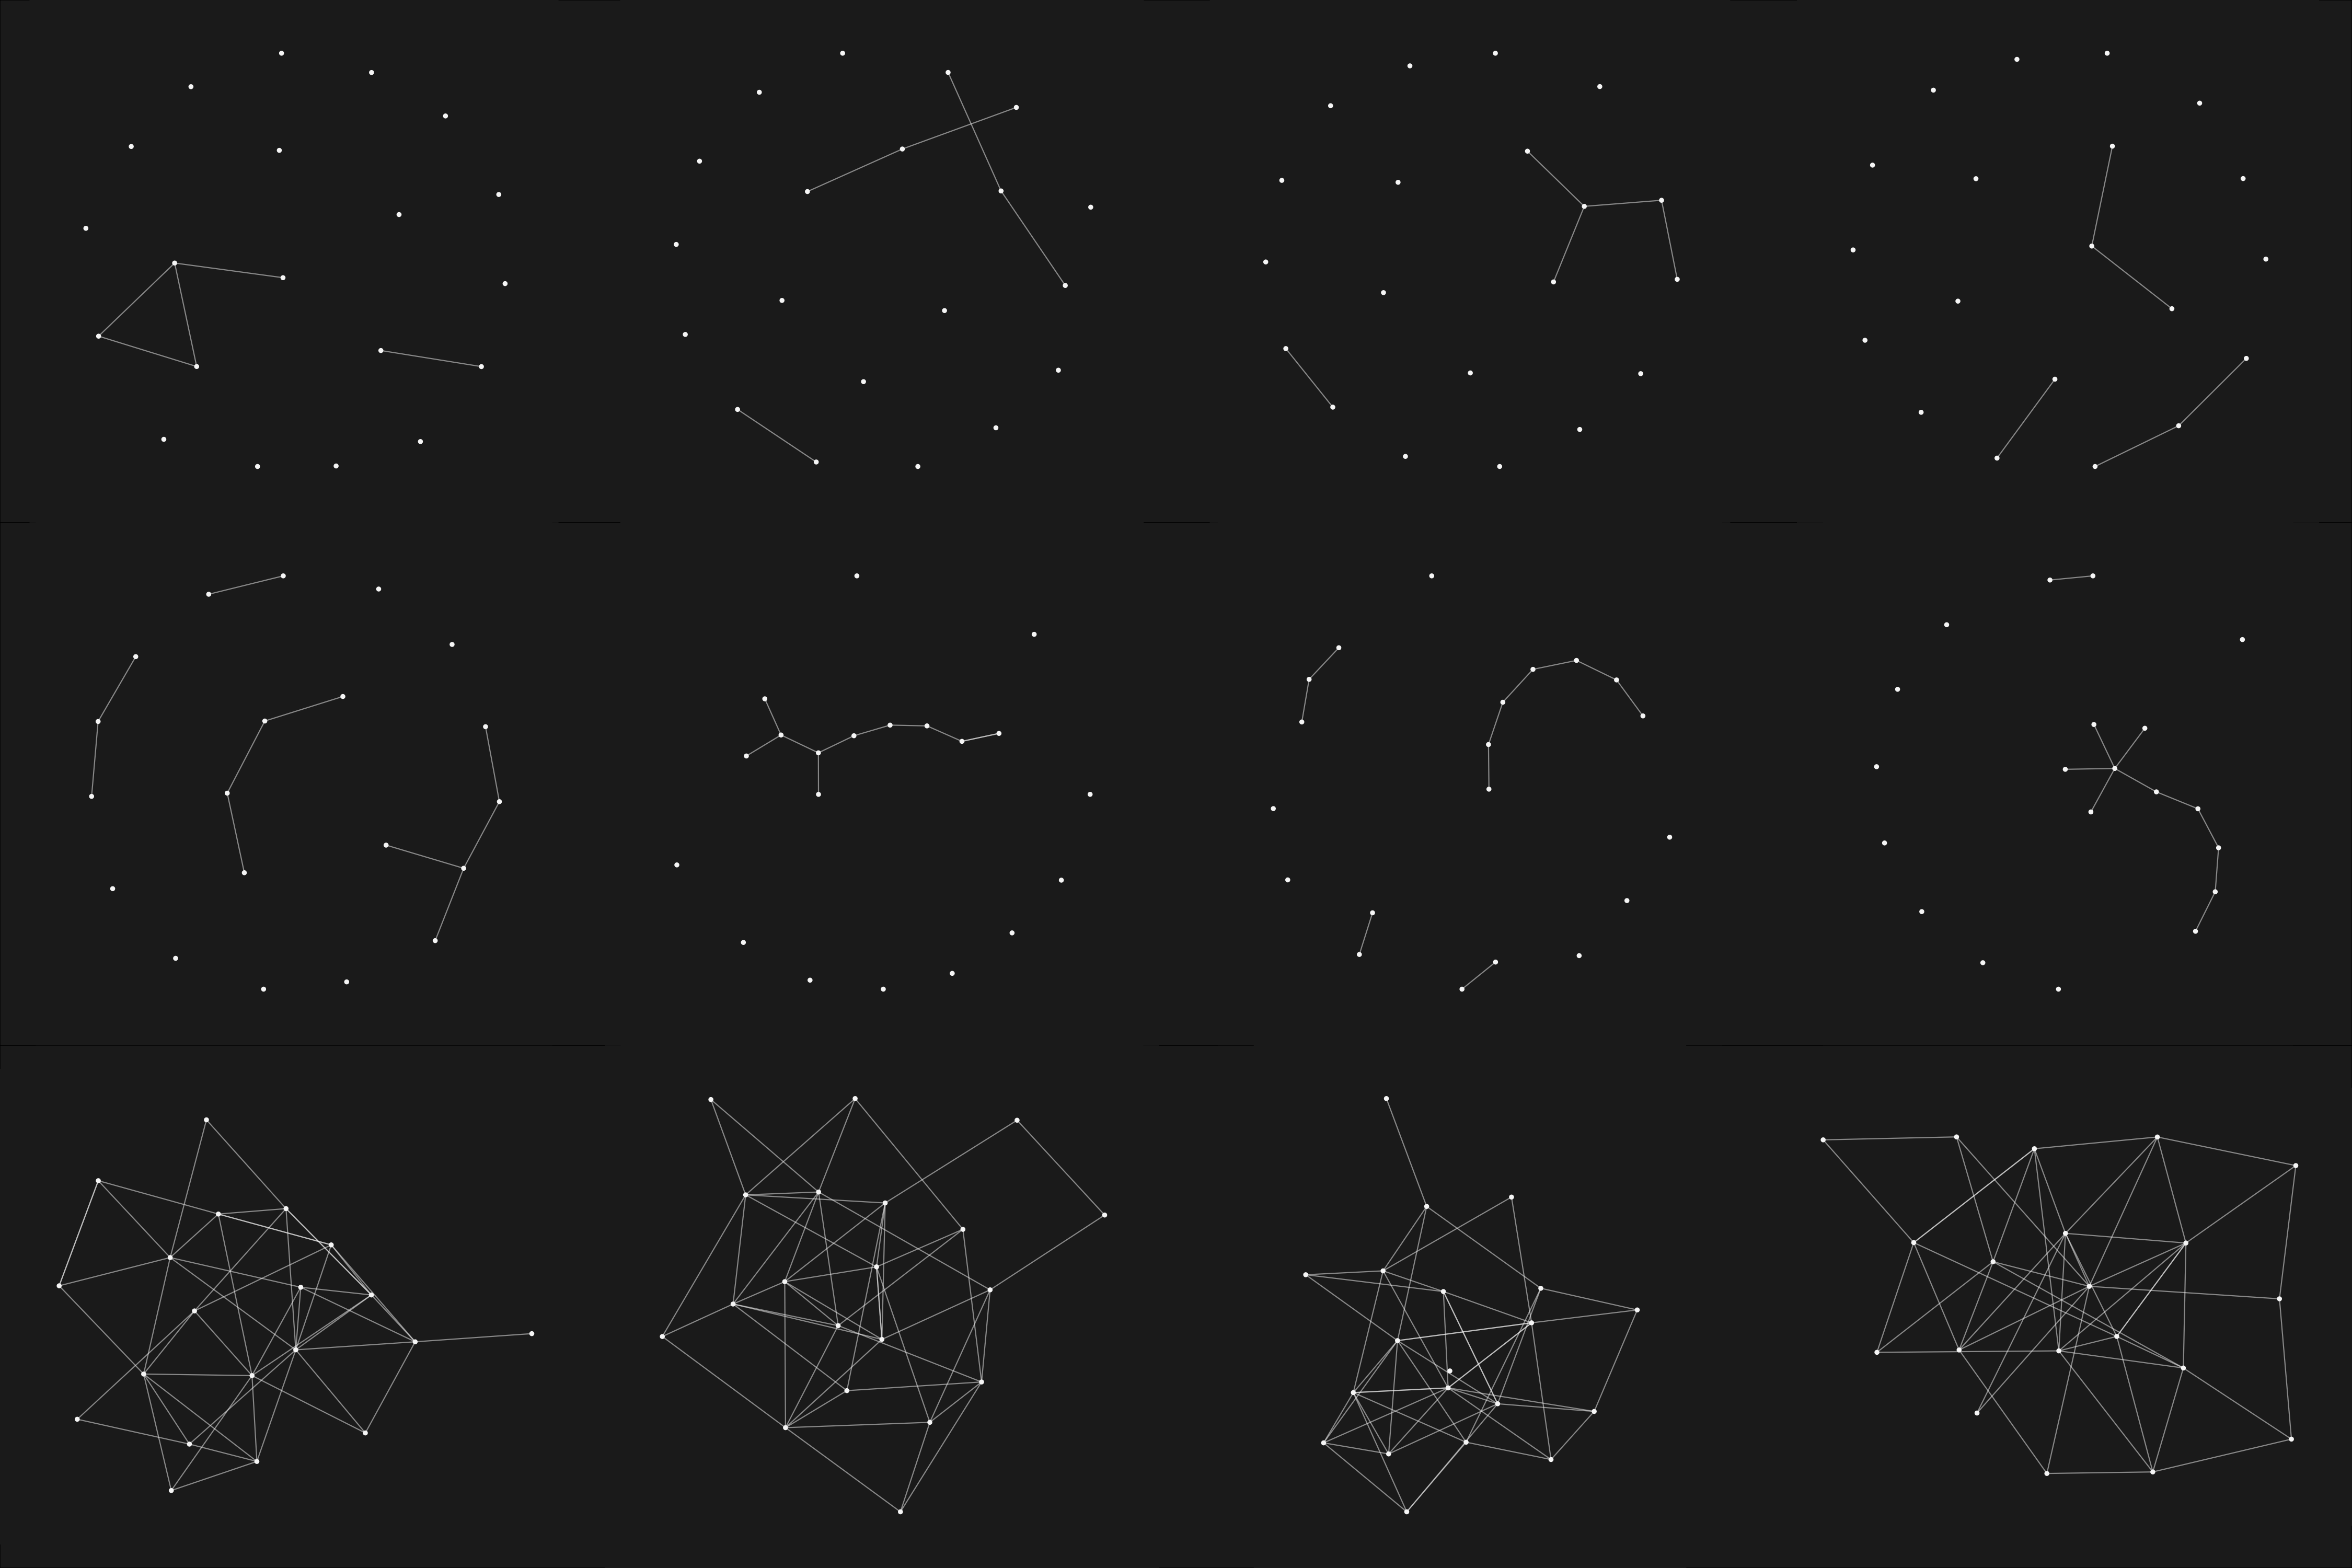
Visualising complete graphs using a variety of network layout algorithms in ggraph
Complete
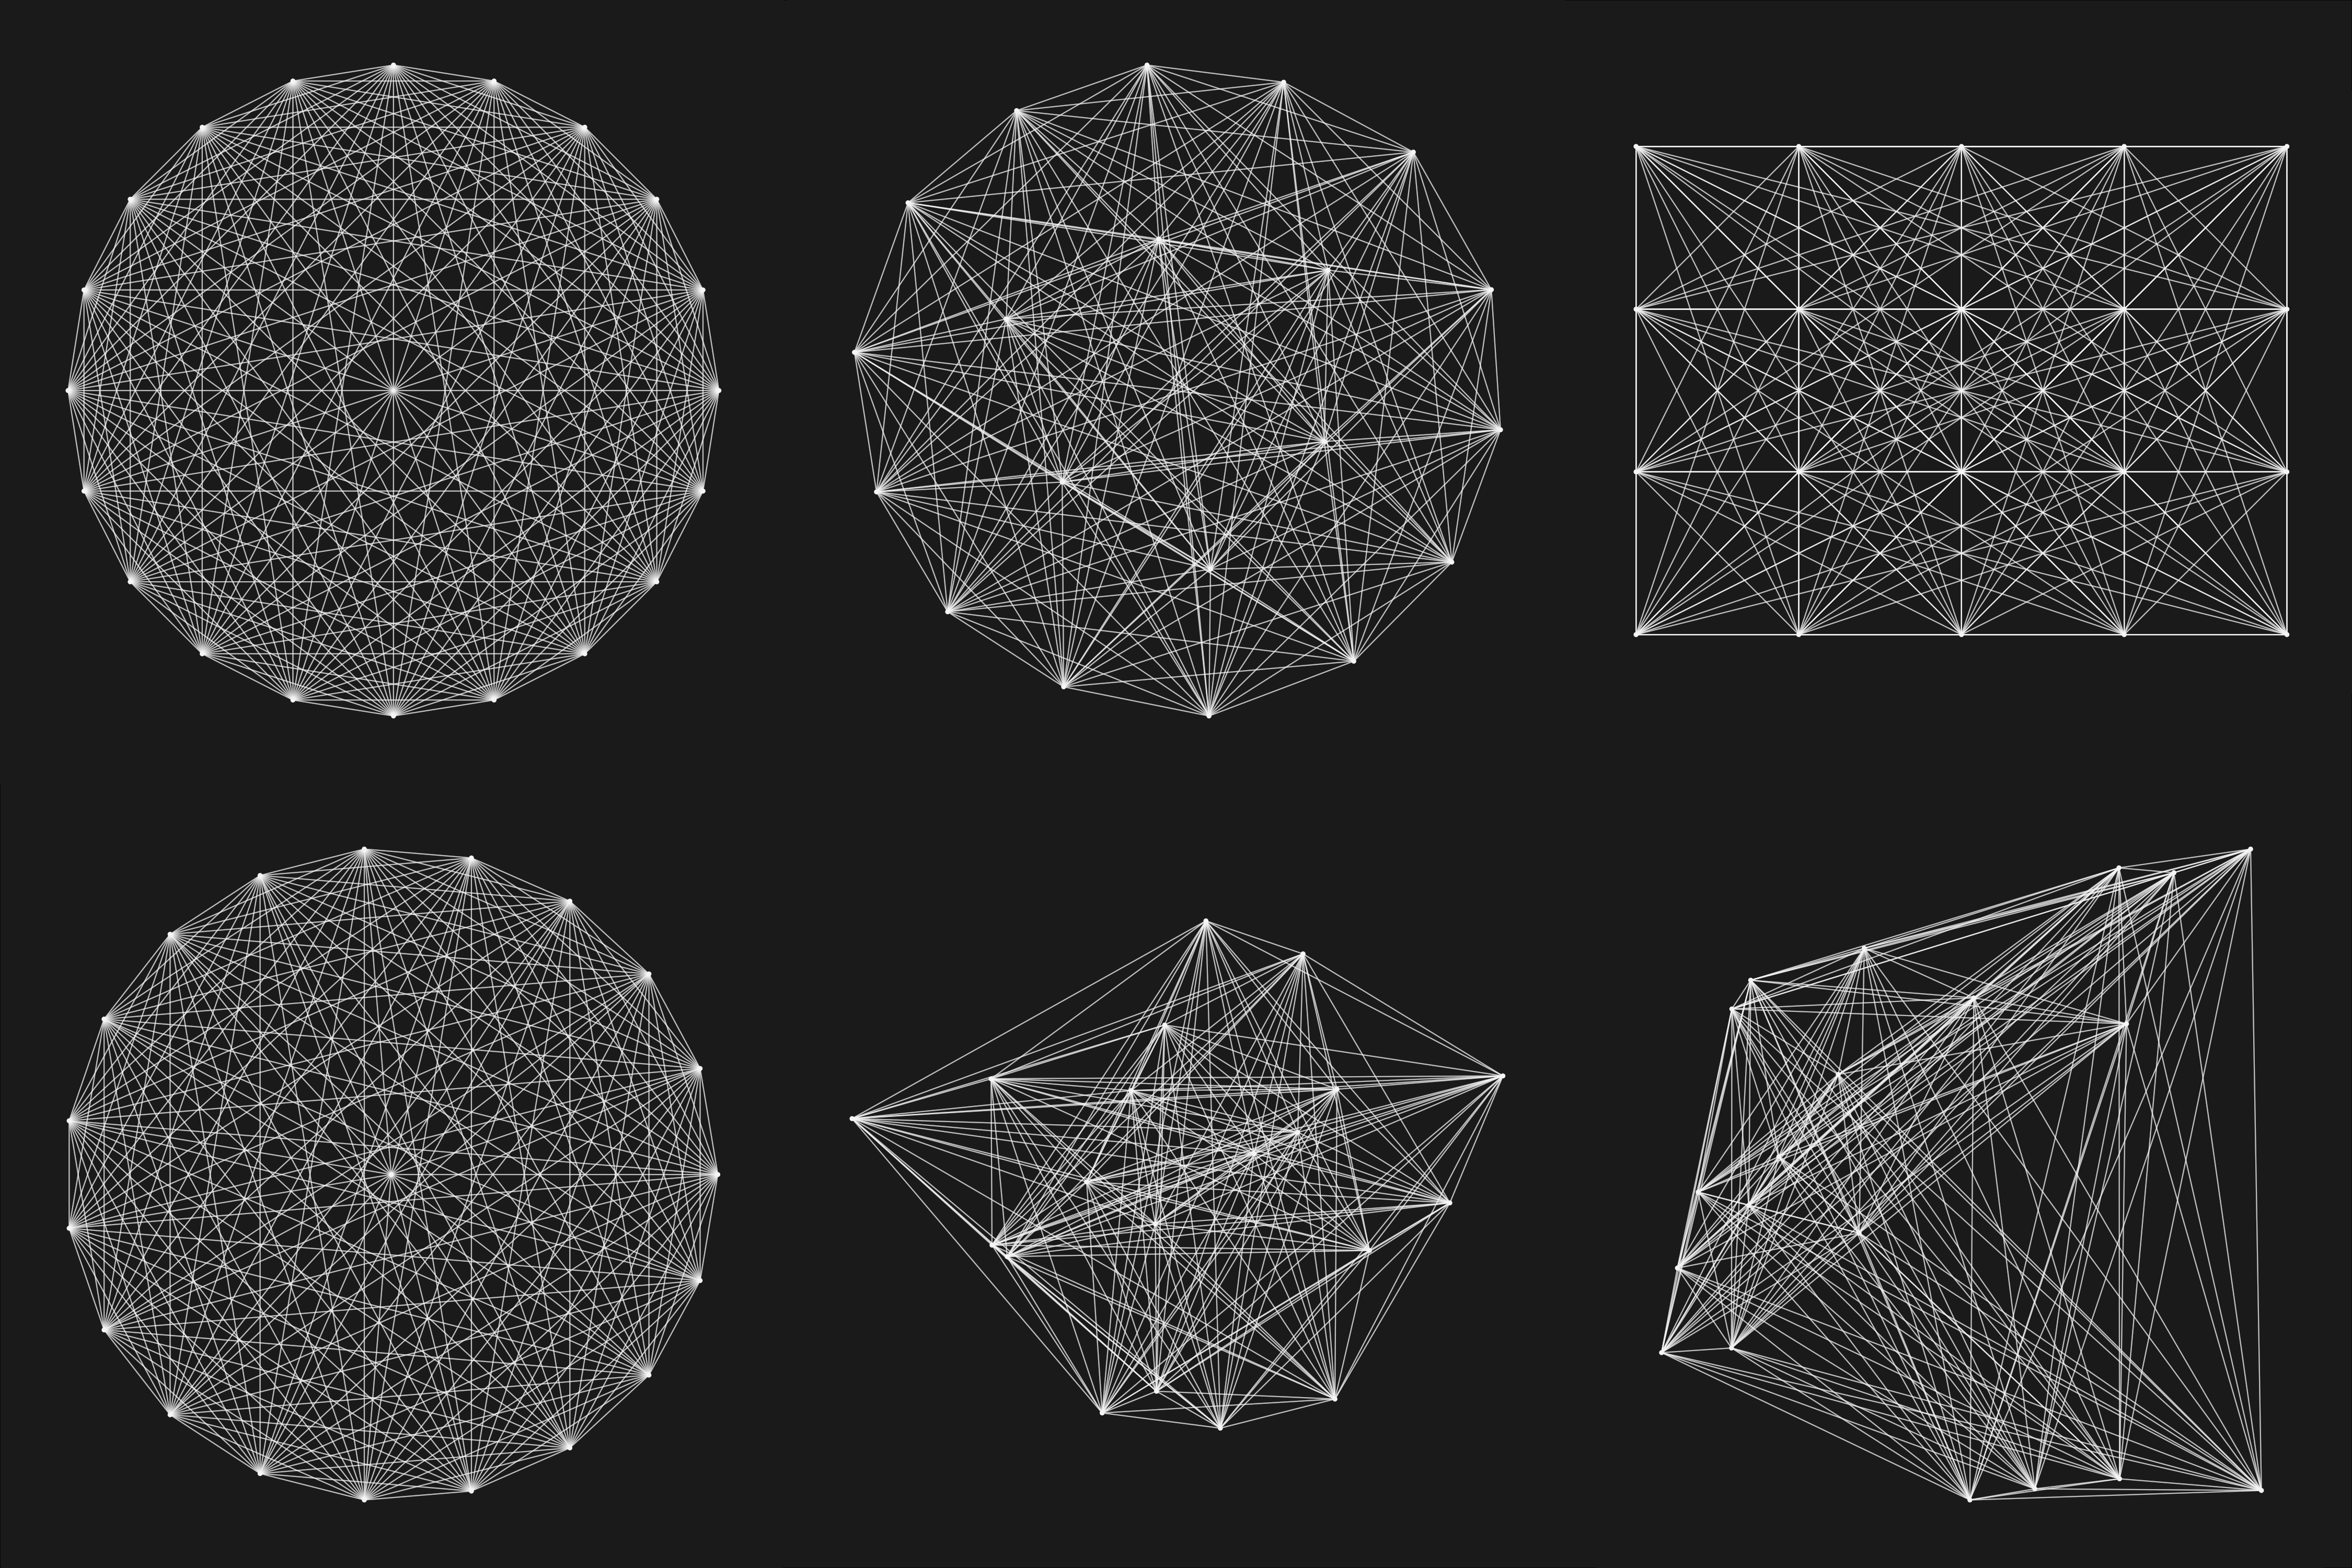
Non complete
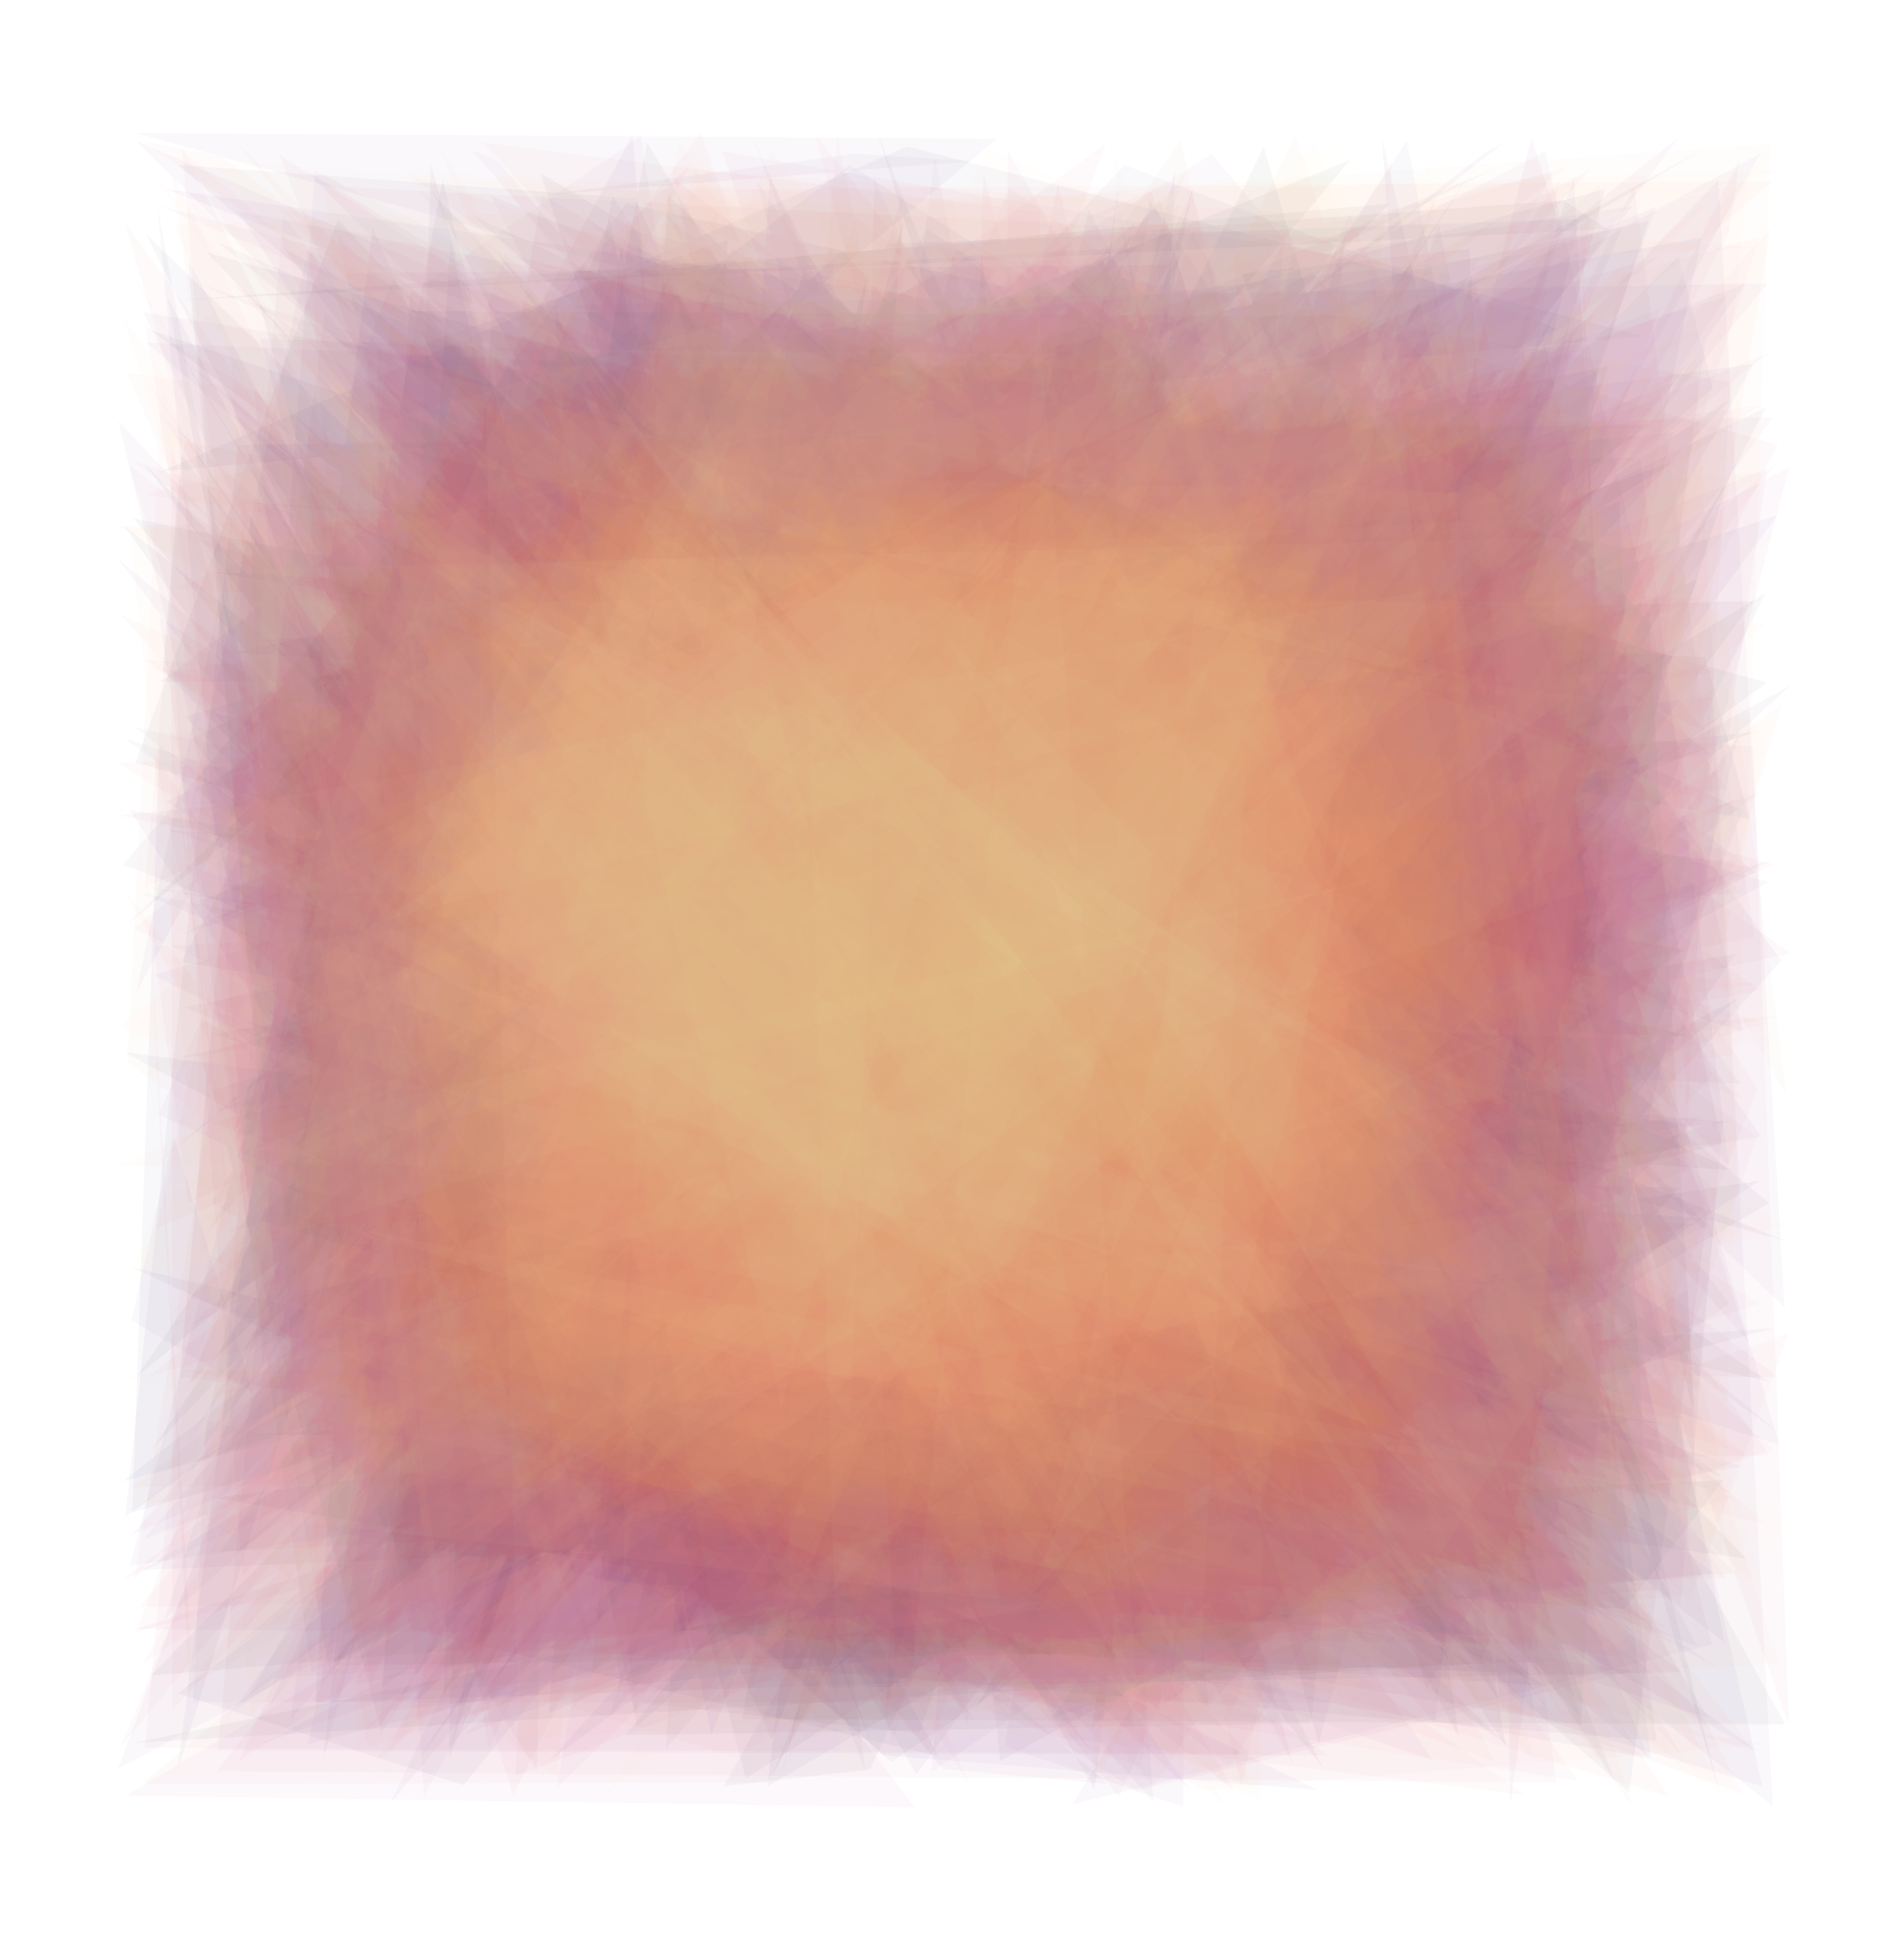
Experimenting with randomization, layering, opacity and colour to create a blended, ‘smudge’ effect
Manipulating force directed algorithms in ggraph
Cats cradle
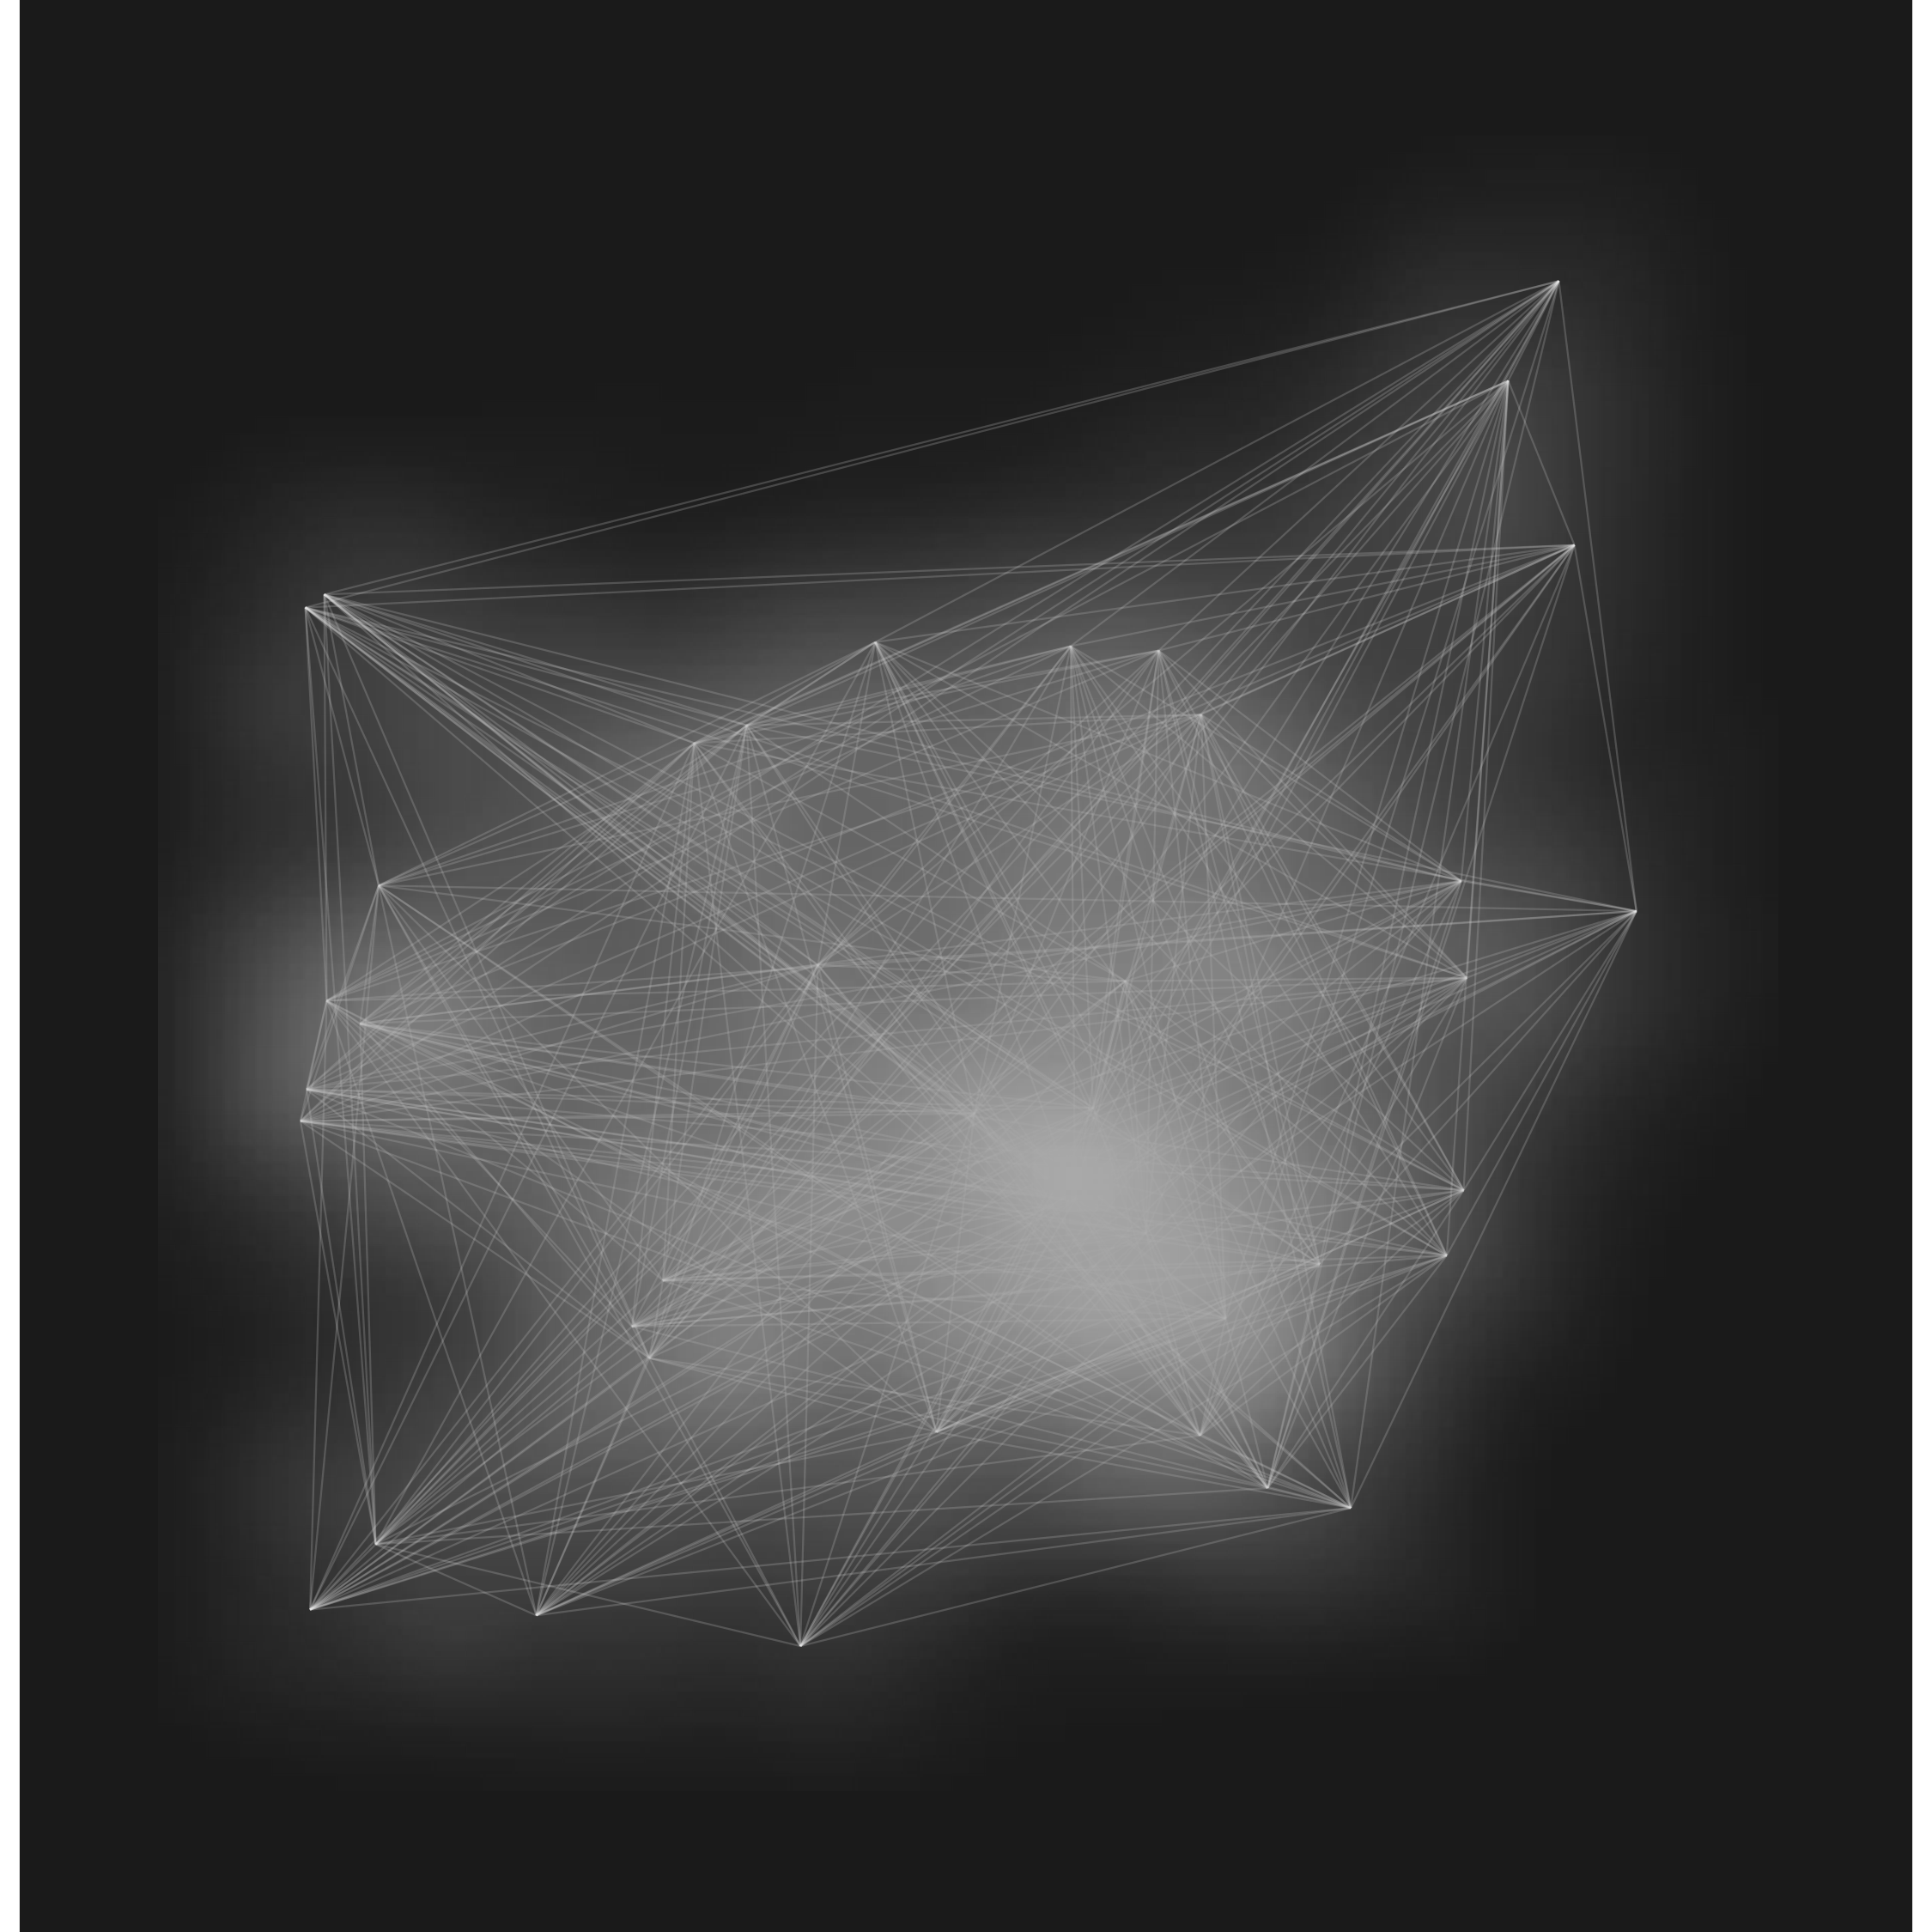
Chordal
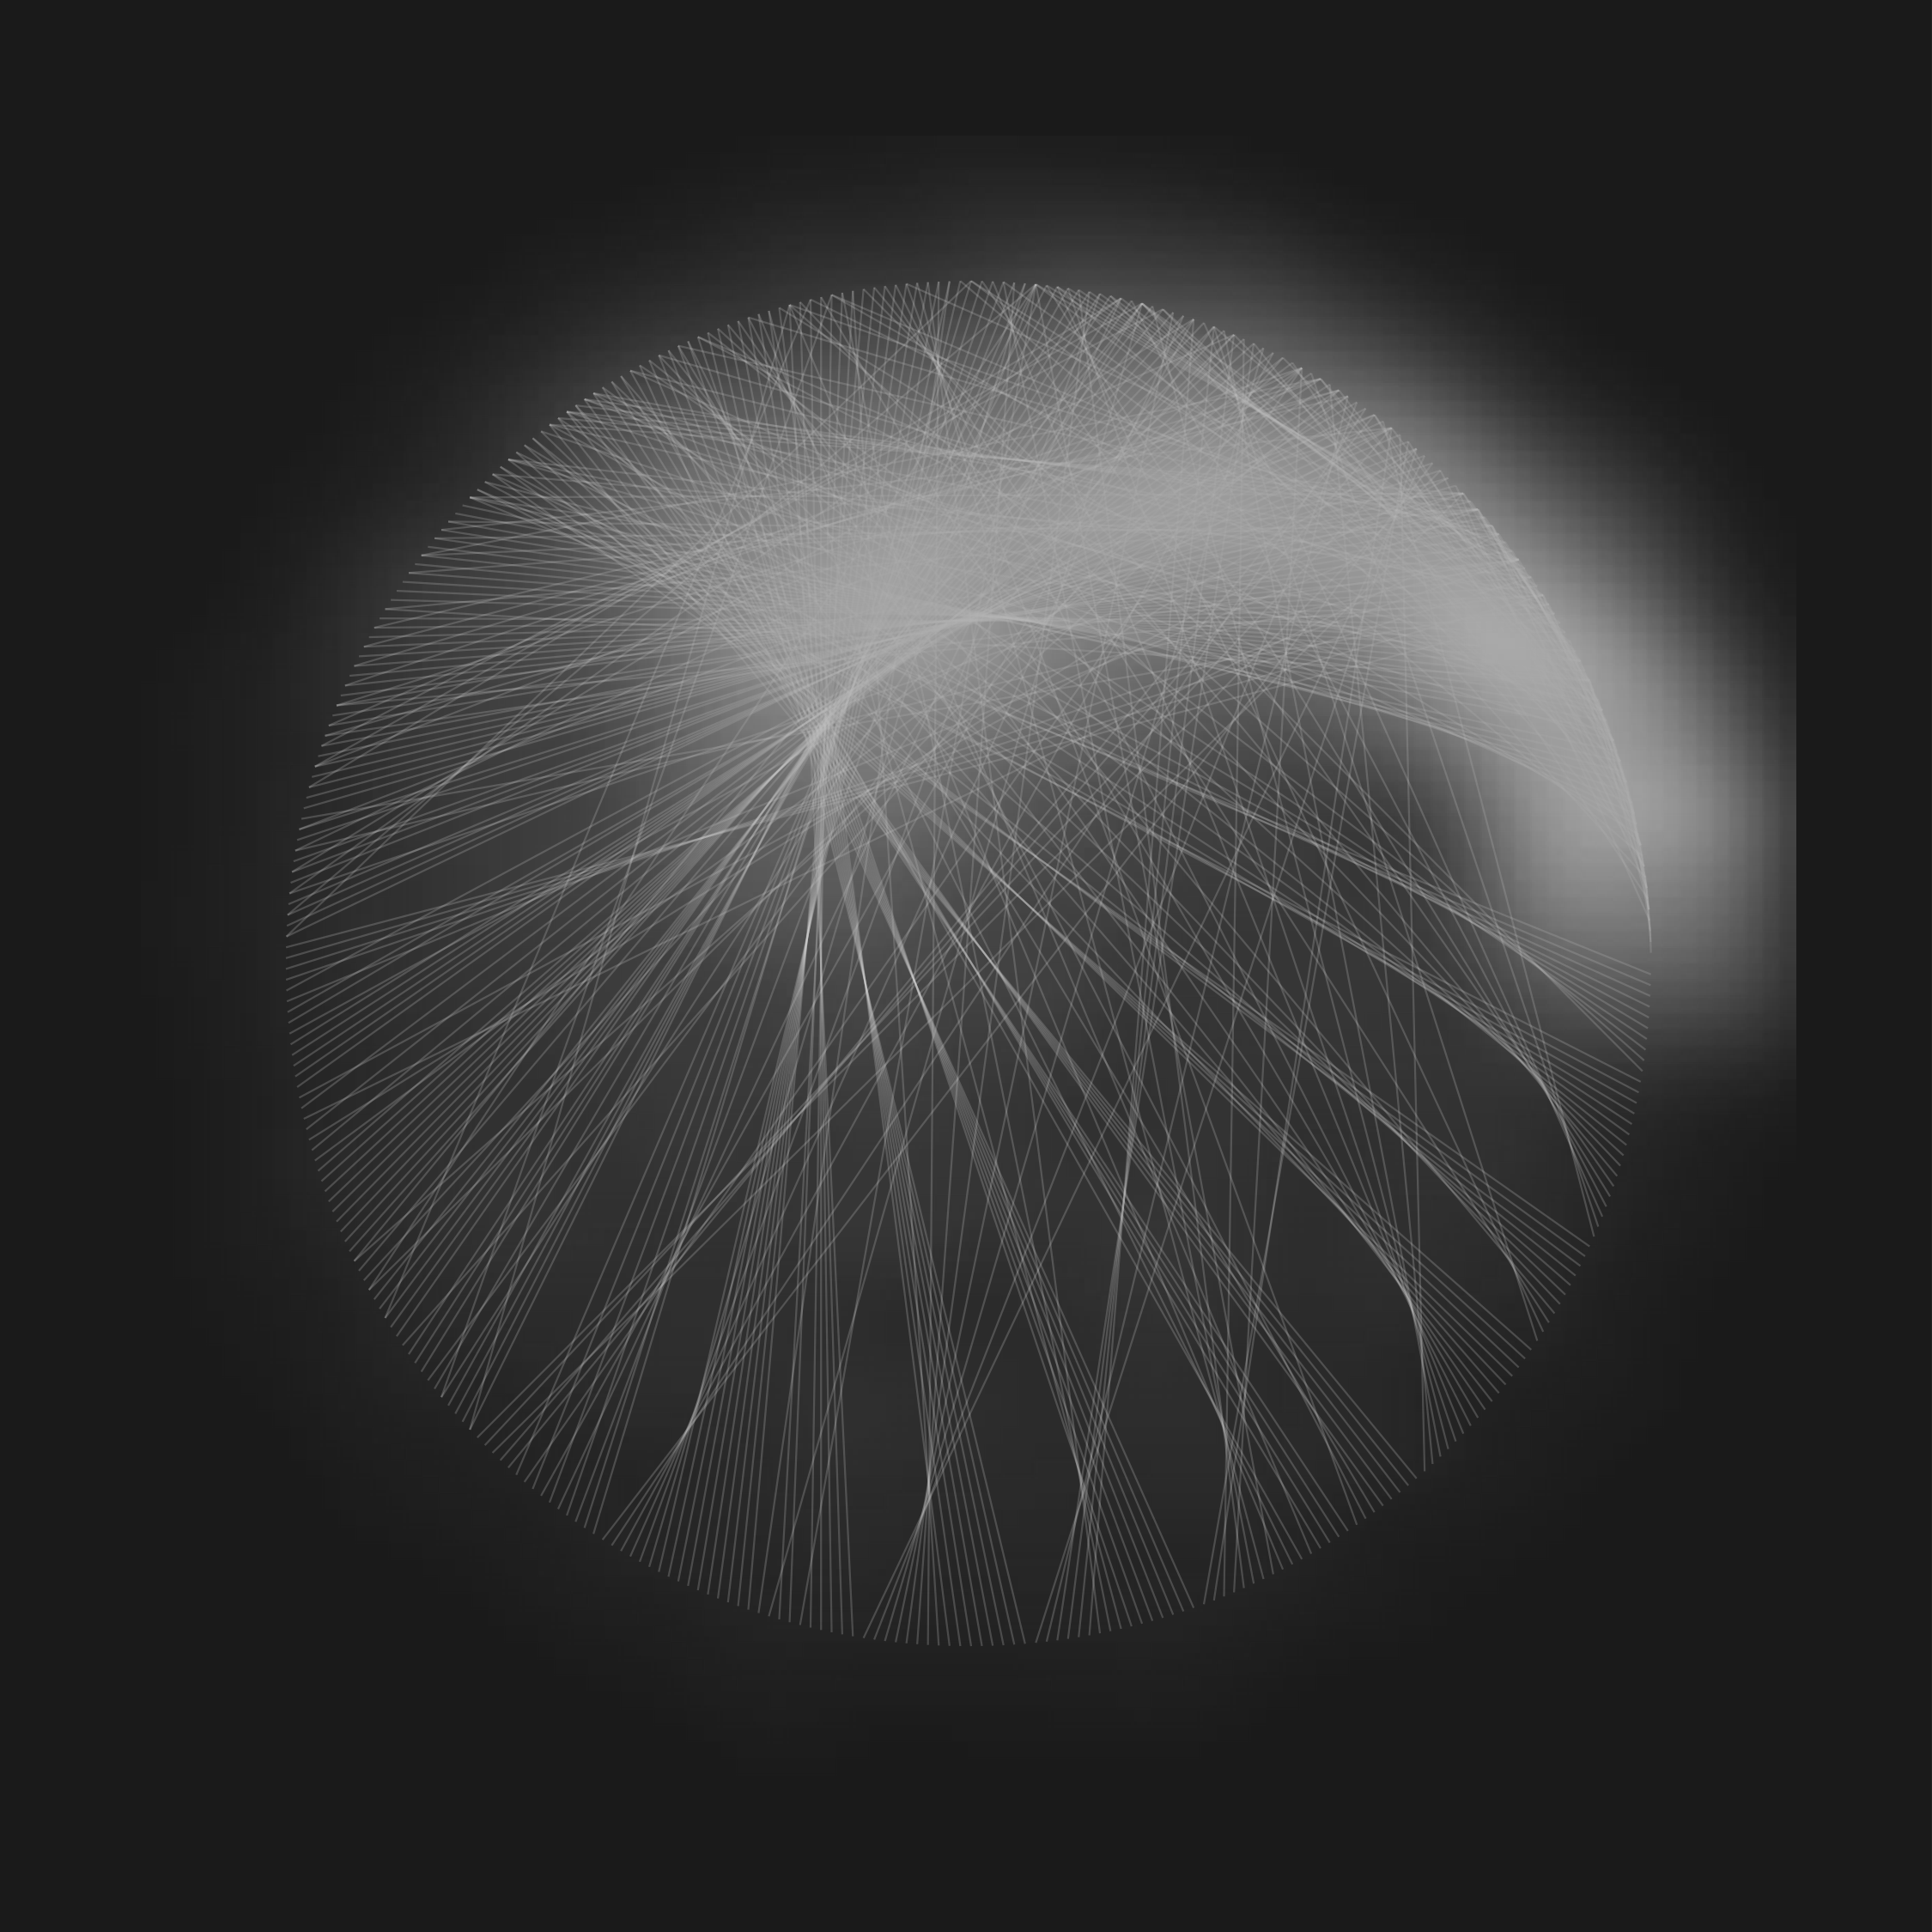
Dandelion
‘Math art’ sketches (mostly using sine and cosine functions)
Stave
Rhizome
Brain
Curl
Melted
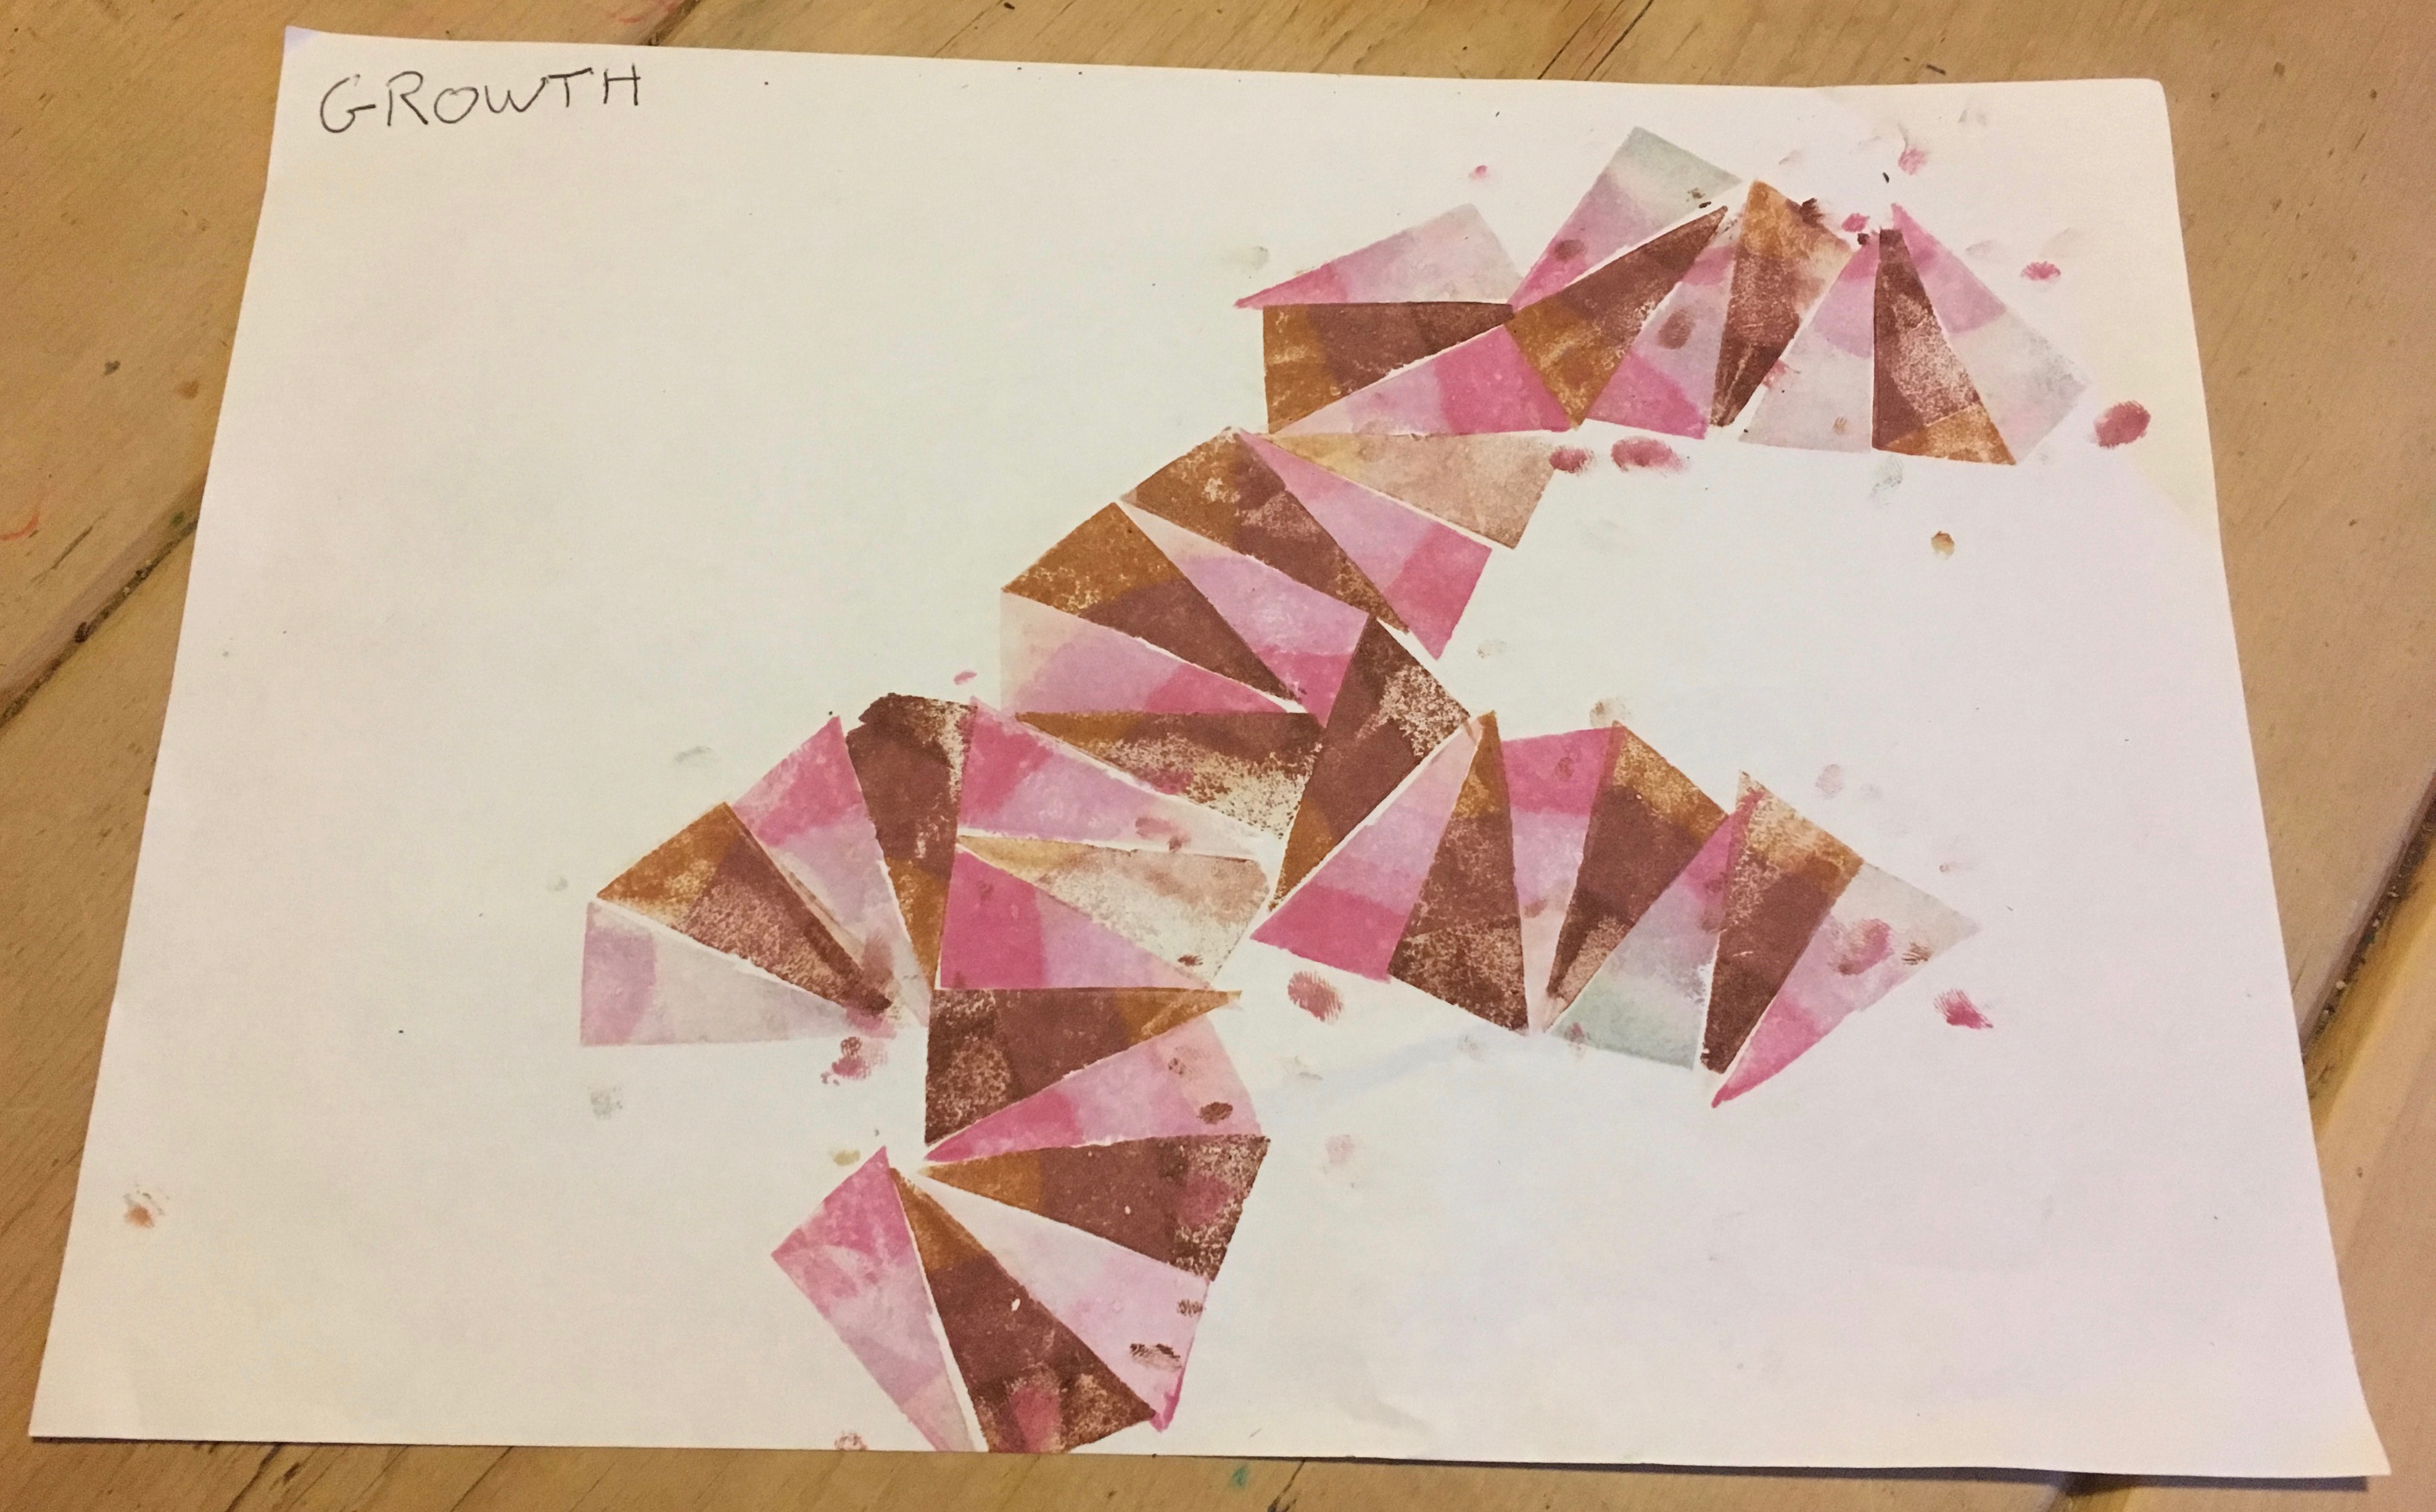
Experiments in visualizing growth patterns in 2D and 3D
Ink
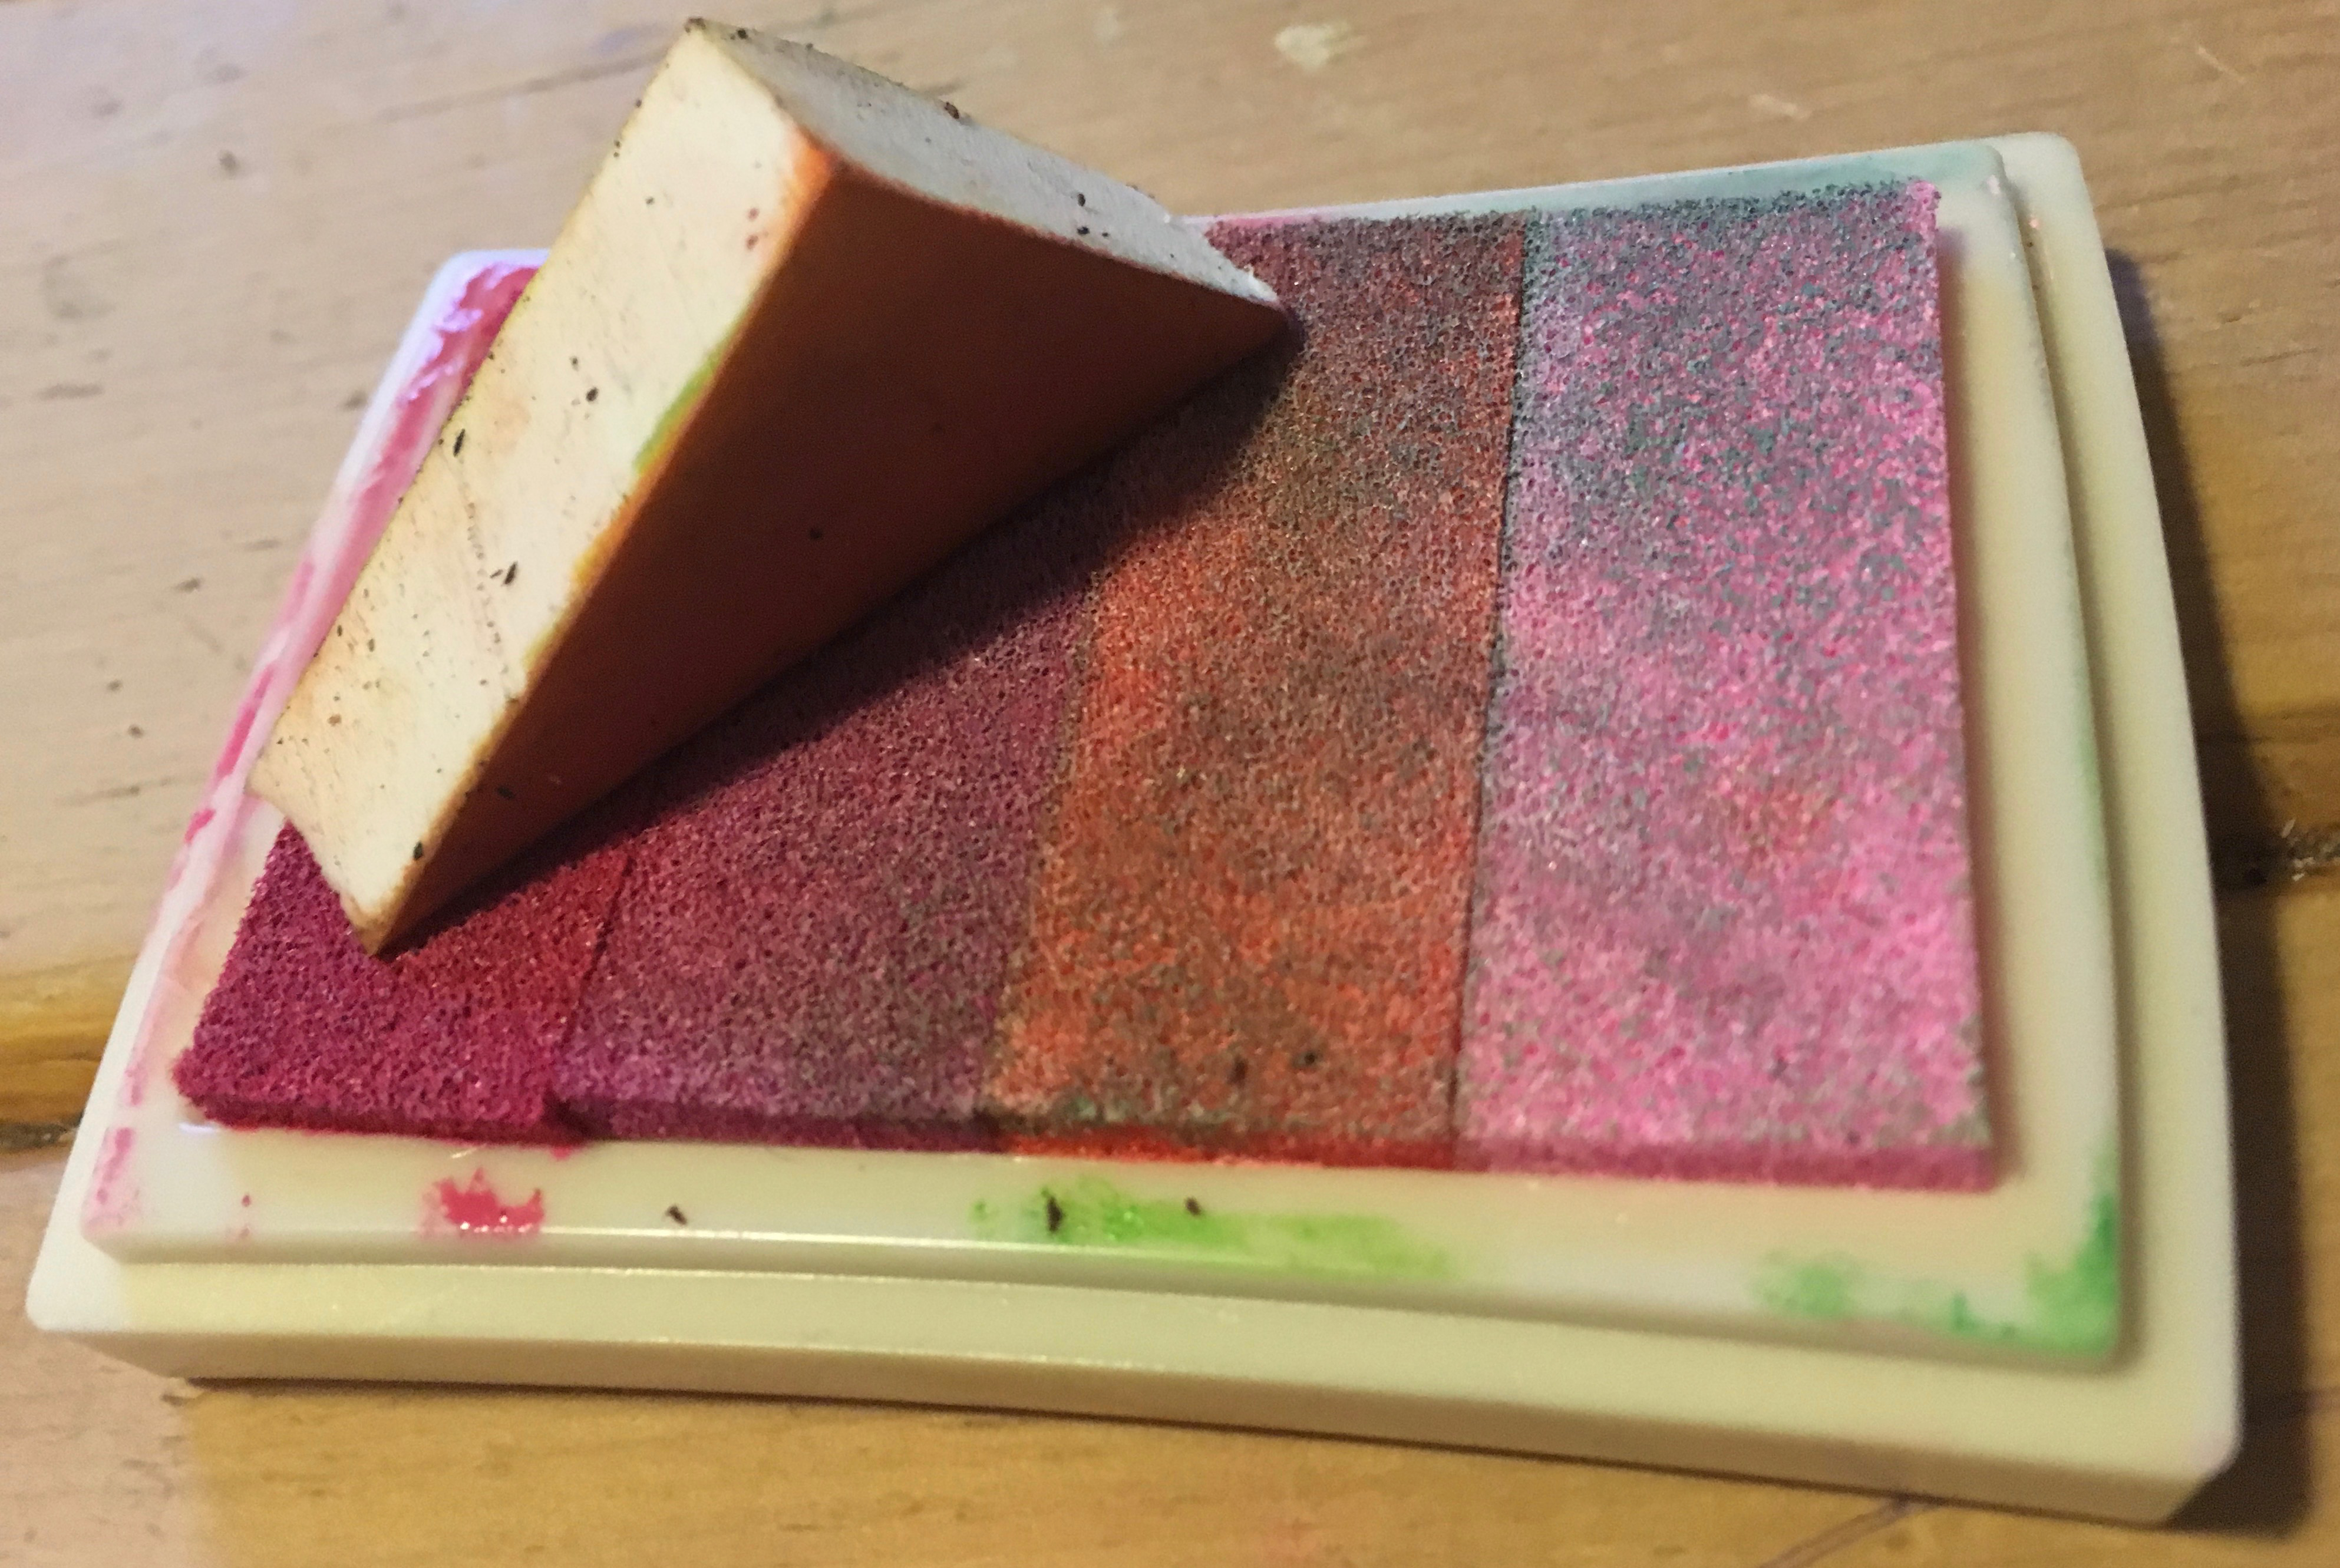
Print sketching 2D Growth
3D growth raw data
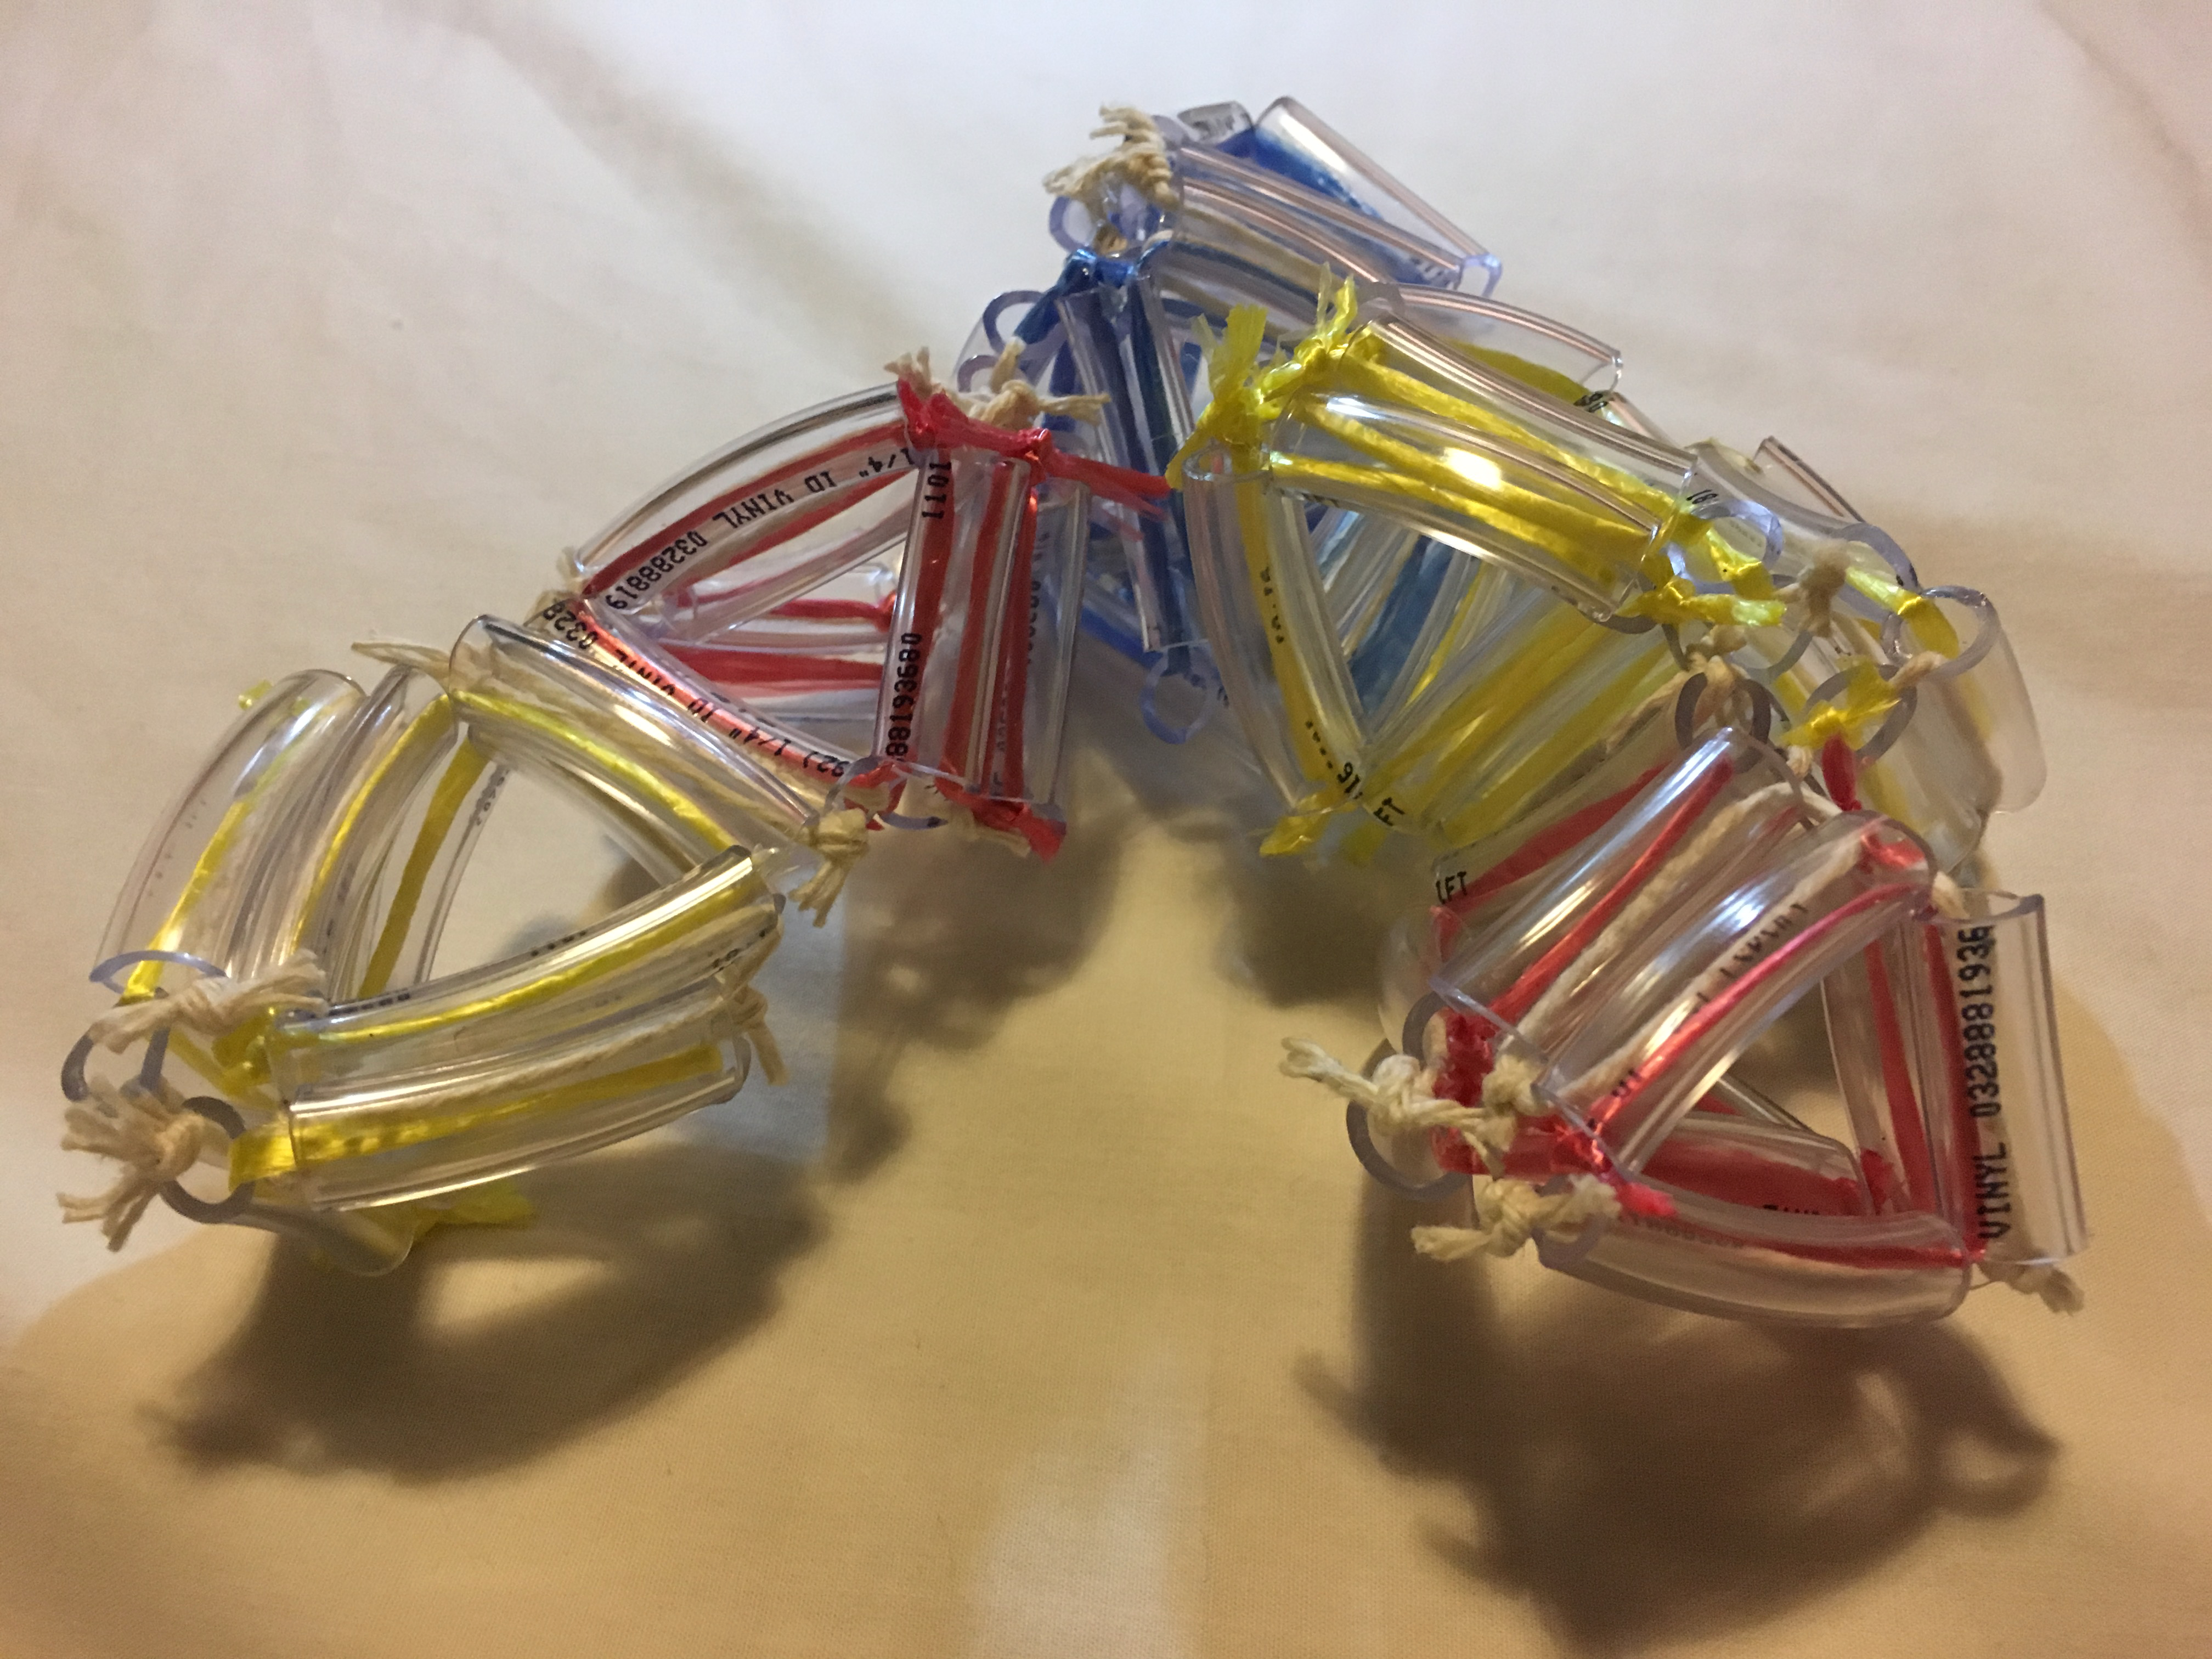
Model of 3D growth: tetrahedral helix